
Data-driven decision making means basing choices on systematically collected and analyzed data rather than guesswork. A company is ready for it when it has enough quality data, clear business objectives, committed leadership, a workable technical foundation, and the willingness to put numbers into decisions.
The 5 cornerstones of data-driven leadership:
- Quality data available from multiple sources
- Clear business objectives and measurable KPIs
- Committed leadership and an evolving data culture
- A technical foundation and the right tools
- Skilled people and continuous learning
More and more growth-company management teams are asking how to make better use of the data they already have. The question is not whether data-driven decision making is worth it. The question is timing: start too early and the project comes back as frustration and wasted months, start too late and a competitor gets there first.
This article gives you three things: five signs for assessing readiness, a table for interpreting your own score, and a 90-day plan for getting moving without a heavy BI project.
Data-driven decision making in brief
- Definition:
- Basing decisions on systematically collected and analyzed data rather than intuition or guesswork.
- When a company is ready:
- When three to five of the five readiness signs apply. The signs are scattered data, a need for numbers behind decisions, time lost to reporting, forward-looking questions, and resources and ownership in place.
- How to start:
- From one scoped business question and a 90-day pilot, not from an organization-wide BI project.
- Most common reason projects fail:
- Trying to do everything at once. Reserve 30-40 % of the project's time and budget for data quality.
How Do You Know Your Company Is Ready for Data-Driven Decisions?
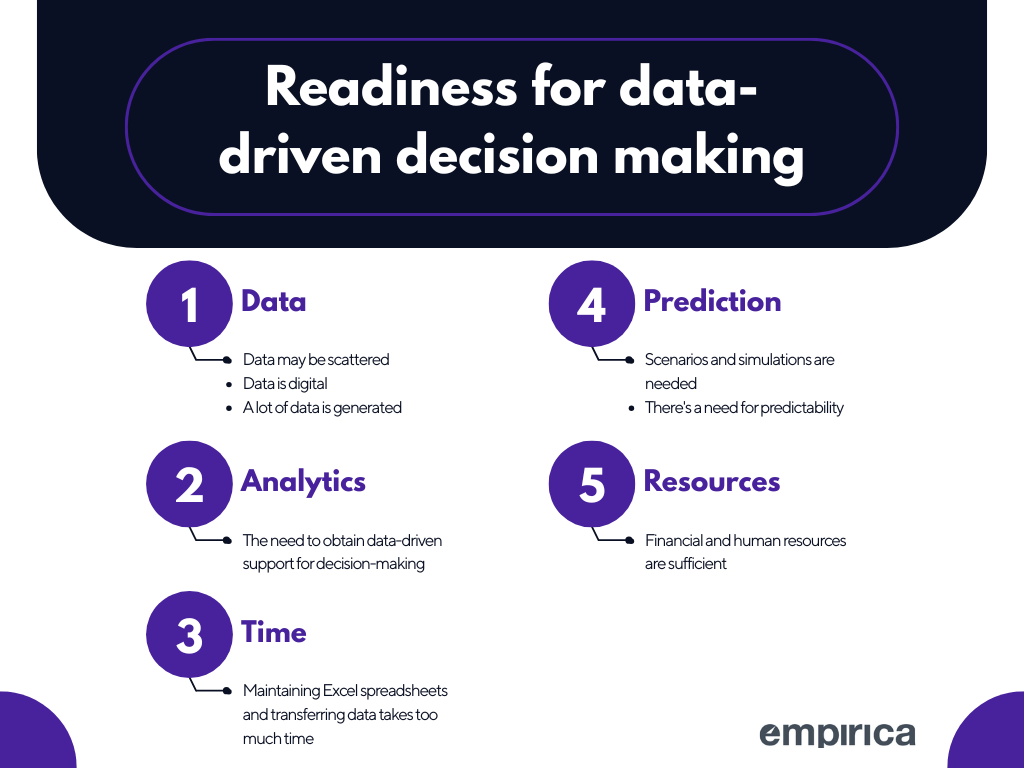
Readiness shows up as five concrete signs. These aren't theory; they're things a management team recognizes from its own week. Go through them and count how many apply to your company.
Sign 1: Data exists, but it's scattered across systems
Your company generates data daily, but it lives in separate places: sales figures in the CRM, financials in the ERP, customer feedback in a survey tool, production data in its own database. When the management team asks what customer acquisition actually costs, no single system has the answer. Each team sees only its own slice.
This isn't a bad sign, quite the opposite. Missing data would be the bad sign. When business data has already accumulated naturally, it can be combined and refined. The same pattern shows up inside a single system too, which we covered in why CRM data alone isn't enough for revenue teams.
Readiness check
- At least 3 different systems produce business data
- Data is in digital form, not paper reports
- Combining data across systems has been attempted, but it's laborious
- People know where the data is, but retrieving it takes time
At least three apply: technical readiness is good. The challenge is connecting the systems, not a lack of data.
Sign 2: Decisions need numbers behind them
Decisions get made on experience. Customer preferences, investment needs, and the competitive situation are assessed from personal observation. The decisions aren't wrong, but afterwards it becomes clear the numbers should have been checked first.
A typical example: a company decides to invest in product A based on customer feedback. Later it turns out product B generates 70% of revenue while accounting for 15% of feedback. Dissatisfied customers give feedback more readily than satisfied ones.
Experience-based decision making isn't a weakness. The ability to question your own decision process is a readiness signal: the best outcome comes from combining experience with data.
Readiness check
- Decisions haven't produced the expected results
- Leadership wants data behind decisions
- There's a desire to test assumptions before large investments
- Competitors appear to be making data-based decisions
At least three apply: the organization has the right attitude. Change won't be resisted.
Sign 3: Reporting eats an unreasonable amount of time
In most companies there's one person maintaining enormous Excel files with dozens of tabs. They spend hours every week copying data from one system to another, and they're the only one who understands how the reports come together.
A controller's week looks like this in practice: Monday, numbers from the ERP. Tuesday, sales figures from the CRM and manual consolidation. Wednesday, fixing errors and checking totals. Thursday, charts and formatting. Friday, report to management. The next week it starts over.
This tells you three things: reporting is needed, the expertise exists in-house, and the current setup won't survive growth. Once a repetitive task is identified, the next question is what should handle it: rule-based automation or a reasoning agent. We compare the two in AI agents vs. traditional automation.
Readiness check
- Producing reports takes at least one day a week of one person's time
- Reports take days or weeks to complete
- Reporting rests on a single person
- Manual errors happen regularly
At least three apply: automation pays for itself quickly, because the saving is directly calculable from hours.
Sign 4: Questions shift from the past to the future
The management team's questions have changed. It used to be what last month's revenue was and how many customers were won. Now it's what happens to sales if the marketing budget goes up 20%, which customer segments to prioritize next quarter, and what a 5% price change on product X would do to margin.
That shift from reporting to anticipation is a clear readiness signal: answering basic questions is no longer enough, and the team wants to forecast and simulate. We covered the shift in more detail in generative AI in analytics.
Readiness check
- Leadership asks more predictive than descriptive questions
- Scenarios need testing before decisions
- Simulation and modeling are in demand
- Ad hoc analysis requests have become common
At least two apply: the company needs anticipation, not just reporting.
Sign 5: Resources and ownership are in place
The financial situation supports an investment that pays back in 6–18 months. Someone is named to own the project, and leadership is willing to participate. Systems are modern enough to get data out of.
A typical situation: the company has grown from 50 people to 150 in five years. Excel-based habits are starting to crack, but there are now people in-house who understand the need and can carry a project through.
Readiness check
- A budget of €20,000–80,000 can be allocated to the project
- The project has an owner
- Leadership actively participates in requirements definition
- Systems support integrations (APIs, modern technologies)
At least three apply: both the people and the money are sufficient to start.
What Does Your Readiness Score Actually Mean?
Count how many signs met their threshold. The result tells you whether to start now, fix a bottleneck first, or come back to this later.
| Signs met | What it means | Where to start |
|---|---|---|
| 4–5 | Readiness is strong: data exists, motivation and resources are in place | One scoped pilot that produces a visible result in 4–8 weeks |
| 3 | The foundation is there, but 1–2 areas hold you back | Identify the bottleneck (data, ownership, or budget) and fix it first |
| 1–2 | Not yet the moment for a broader project | Process digitalization and systematic data collection |
| 0 | Not enough data is being generated to base decisions on | Start measuring: which numbers you track and who owns them |
Note that "not yet" doesn't mean "never." A company at three or four signs usually reaches strong readiness within a few months through a single fix, most often by naming an owner for the project.
Why Do Data-Driven Projects Fail?
Even with readiness in place, a project can collapse. Five reasons come up far more often than the rest.
1. Doing everything at once. A BI platform is bought with the expectation it will solve everything. The project swells, the budget overruns, and nobody uses the result. Start from one question, for example how do we forecast next quarter's sales to within 10% or which of our customers are at highest risk of leaving.
2. Business and IT don't work together. The project is delegated to IT without business ownership, and the result is technically functional but useless day to day. Ownership belongs to the business; IT is the enabler. A working setup: a business owner (controller or sales lead), a data specialist, and IT covering integrations.
3. Data quality is ignored. Analytics gets built before the data is in shape, and the result is the familiar "garbage in, garbage out." Reserve 30–40% of the project's time and budget for data quality: removing duplicates, standardizing formats, defining input rules, and automating validation.
4. Buying a tool before setting a goal. The best-known tool on the market gets picked with the assumption it will solve the problem. Define objectives and metrics first, map data and integrations, then choose the tool. The most expensive option isn't the best one. The best one is the one your team actually uses.
5. Change management is forgotten. New tools arrive as a surprise, the benefits aren't understood, and people worry about their own role. Communicate the reasons clearly, involve key people early, and train properly. Learning can't be left to chance.
How Do You Start Data-Driven Decision Making in 90 Days?
If you recognized your company as ready, a three-month plan gets you to a first measurable result. Each phase has one goal and one concrete output.
| Period | Goal | Output |
|---|---|---|
| Weeks 1–2 | Clarify which problem you're solving | A one-page document: goal and metrics |
| Weeks 3–4 | Establish what data exists and what shape it's in | A table of data sources: location, quality, integrability |
| Weeks 5–8 | Design a minimal working pilot | A project plan and a chosen pilot area |
| Weeks 9–12 | Build, test, and measure | A working pilot and a decision on next steps |
Weeks 1–2: clarifying objectives. Run a 2–3 hour workshop with leadership and list the 3–5 most critical business questions. Prioritize by what produces the most value fastest. Define success in numbers: improved decision making doesn't count, forecast accuracy improves by 15% and reporting takes 20 hours less per week does.
Weeks 3–4: mapping the current state. Establish what data you have, which systems produce it, in what format, and how often it updates. Assess quality with a random sample: errors, gaps, duplicates, and whether history is sufficient, typically at least a year. Map integrations: do systems support APIs, are intermediate steps needed, and who manages access.
Weeks 5–8: designing the pilot. Pick a limited but business-relevant process where results show in 4–8 weeks. Decide on technology: an existing tool is often enough for a pilot, as long as it doesn't lock you into long license agreements. Assemble the team: an owner, 2–3 key users, and technical support in-house or from a partner. Write down milestones, responsibilities, and risks.
Weeks 9–12: building and learning. Integrate and clean the data you need, build a simple view, and test it with a limited user group. Collect feedback weekly, measure results against the original goals, and calculate a preliminary payback. A successful pilot gets expanded; an unsuccessful one gets analyzed and adjusted. Both are acceptable outcomes as long as you know why.
Is It Worth Waiting for a Better Moment?
It isn't. Many companies postpone because data quality doesn't feel good enough, no owner can be found, or a system project is underway. The perfect moment never arrives, because data doesn't improve on its own. It improves once people start using it.
If you found 3–5 of these signs in your company, readiness is sufficient. Start small, learn fast, and expand as successes accumulate. The same principle applies to business process automation: one defined target at a time, not everything at once.
In practice the first step is identifying where the benefit appears fastest. That doesn't require your own data team: a fixed-price Automation Assessment walks through your processes and tells you which targets to take first and what they're worth in euros. Implementations are built on Microsoft Azure, and we're a Claude Partner Network member, so where data is processed and who can access it is known from the start.
Three things to remember:
- Data doesn't improve on its own; it improves when it gets used
- Organizations don't change all at once; they change step by step
- Payback doesn't come from waiting; it comes from doing
Frequently Asked Questions
What does data-driven decision making mean?
Data-driven decision making means basing decisions on systematically collected and analyzed data rather than intuition or guesswork. A company is ready for it when it has enough quality data, clear business objectives, committed leadership, a technical foundation, and a data culture in the organization.
When is a company ready for data-driven decision making?
Five signs indicate readiness: data is generated but scattered across systems, decisions need analytics behind them, reporting and Excel take too much time, leadership's questions shift from past reporting to anticipation, and financial and people resources support the work. When 3–5 of these signs are present, readiness to start is sufficient.
How should a company start with data-driven decision making?
Start from one scoped business question and a pilot that produces visible results fast. In the first 90 days, clarify goals and metrics, map your current data and its quality, design a minimal viable pilot, and run it with a limited user group. Don't wait for the perfect moment: start small, learn fast, and expand as successes come.
What is the difference between data-driven and information-driven leadership?
In practice they mean the same thing: decision making based on collected and analyzed data rather than guesswork. Data-driven emphasizes the role of the raw data itself, while information-driven emphasizes the refined insight. On this page we use them interchangeably.
Want to identify your company's biggest automation opportunities?
The Automation Assessment reviews your operations and shows where data-driven decision-making and automation are worth starting, and how much they deliver.
Book an Automation AssessmentEmpirica helps growth companies turn scattered data into visibility, better decisions, and automation. The Automation Assessment is a fixed-price way to find out where to start.