
CRM data isn't enough for a growing company because the CRM only shows what the sales team recorded. Slipping delivery projects, late billing, a rising ticket count, and fading account activity are all early signs of revenue risk, and they all happen in systems the CRM isn't connected to. Visibility doesn't improve with another report. It improves when the CRM, ERP, finance, and support systems feed the same view automatically.
The CRM isn't wrong. It's limited. It answers "where is this deal" accurately, and it was never built to answer "how is this customer actually doing".
In a growing company that gap widens fast. When the customer count doubles, so does the volume of delivery and support events, and none of it lands in the CRM. Leadership keeps looking at the same pipeline view while making decisions on a shrinking share of what matters.
Why CRM data isn't enough, in brief
- What the CRM shows:
- Leads, opportunities, quotes and the forecast, meaning what the sales team recorded.
- What it misses:
- Delivery delays, billing problems, rising ticket volume and fading account activity, all of which predict future revenue risk.
- Why another dashboard doesn't help:
- A dashboard only shows the data already brought into it. Fix how the data moves first, then how it is presented.
- How it is fixed:
- Integrations between existing systems, a shared customer identifier, and rules for what counts as an exception. Not a new CRM.
What Does the CRM Show and What Does It Miss?
The CRM is built to manage customer relationships and the sales process. It holds leads, opportunities, meetings, quotes, and forecasts. Everything else about the customer is created elsewhere: in the ERP and finance system, in project management, in the ticketing system, in marketing tools, and in delivery systems.
| Area | CRM alone | CRM plus operational visibility |
|---|---|---|
| Sales pipeline | Visible in real time | Visible in real time |
| Delivery projects | Not visible | Delays and risks visible early |
| Customer onboarding | Not systematically tracked | Progress and bottlenecks visible |
| Support tickets and satisfaction | Siloed in a separate system | Connected into the full picture |
| Billing and account activity | Siloed in finance | Connected as a risk signal |
| Risk detection | Only once it hits revenue | Before it hits revenue |
So the problem isn't the quality of the CRM. It's the assumption that everything relevant lives inside it. We covered the same phenomenon from another angle in why a traditional CRM slows scaleup growth: a system designed to record the past starts to slow down the management of growth.
Why Do Revenue Risks Appear Outside the CRM First?
Growth rarely stalls in the pipeline. It stalls in delivery and in the day-to-day of the customer relationship, and it surfaces in the pipeline months later as a renewal that never happened.
The typical early signals:
- A delivery project runs past the agreed schedule.
- Onboarding stops and nobody owns it.
- Support tickets pile up on the same account.
- Billing slips, or the same invoices get disputed repeatedly.
- Account activity fades: fewer contacts, lower usage.
Every one of these exists in some system, on time. They just aren't in the same place, and nobody looks at them together. By the time the account manager hears about it, the news usually comes from the customer in the form of a cancellation.
A worked example: if one account is worth €30,000 a year and three of them churn quietly in a year, that's €90,000. The same information existed three months earlier, spread across four systems and on nobody's screen.
Why Doesn't Another Dashboard Fix the Visibility Problem?
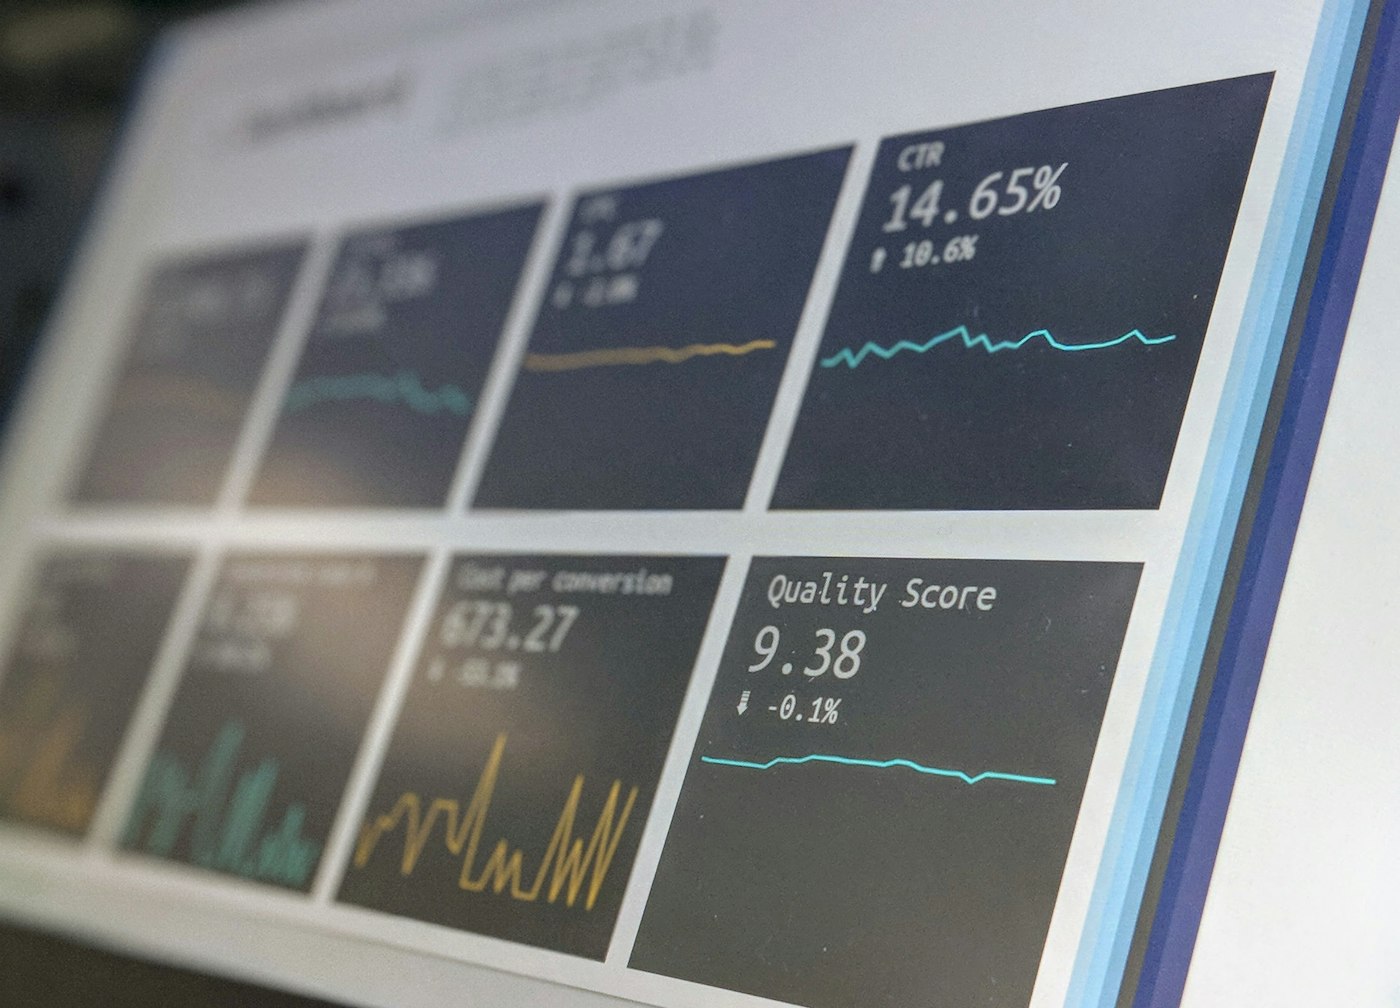
The most common response to a visibility problem is to build another report. It doesn't help, because a dashboard only shows the data that has already been brought into it. If the systems don't talk to each other, the report still tells you one system's truth, just in a nicer layout.
The other common workaround is compiling the numbers into a spreadsheet by hand. That works once. If compiling takes two hours a week, it costs around 100 hours a year, and the numbers are stale by the time they're finished. This is part of a wider pattern we covered in the hidden cost of manual sales operations.
The difference comes down to three things:
- Data moves between systems automatically, not by hand once a week.
- Exceptions are surfaced by rule, for example when a delivery runs past its agreed duration or billing slips for the second time in a row.
- Interpretation comes last. Once the underlying data is solid, AI can find meaningful changes in unstructured information such as tickets and notes, something we covered in generative AI in analytics.
The order matters. AI on top of fragmented data just produces uncertain answers faster.
What questions would you ask your own sales data?
In this Sales Data Analysis Guide, we walk through 10 concrete questions every sales manager should be able to ask their sales data and what kind of answers to expect.
By submitting your email you agree to our privacy policy.
What Does Operational Visibility Require in Practice?
Not a new CRM. In practice it takes three things, all built on top of the systems you already have.
1. Integrations between existing systems. The CRM, ERP, finance system, project management, and ticketing feed one place at an agreed cadence. Most of them already have an interface, so the work is modeling the data and setting the cadence, not buying another platform.
2. A shared customer identifier. The same customer appears under a different name and a different ID in each system. This is the most common reason a first attempt at connecting data fails, and it is worth solving before anything gets built.
3. Rules for what counts as an exception. Visibility isn't having all the data on screen. It's having the three things that matter surface without anyone going looking for them.
Implementations are built on Microsoft Azure, and we're a Claude Partner Network member. In practice that means where data is processed, who can access it, and what gets logged are known from the start, and customer data isn't moved to outside services without asking. Once connected data is turned into forecasts and recommendations, you're in revenue intelligence territory.
Where Should You Start?
Visibility isn't worth building for the whole business at once. These steps move things forward without a separate project:
- List the systems where customer data is created. Usually there are four to six.
- Pick three signals that would have predicted last year's lost accounts.
- Check whether the same customer can be matched across those systems by a shared identifier.
- Count how many hours a month go into compiling the numbers, and whose hours they are.
- Connect one system to the CRM and track a single signal automatically for a month.
If the list won't fall into order on its own, a fixed-price Automation Assessment walks through your operational processes and tells you which targets to connect and automate first and what they're worth in euros.
The CRM tells you what your sales team knows about the customer. Operational visibility tells you what's actually happening in the relationship. The gap between the two decides whether you catch the obstacles to growth early or read about them in the revenue figures.
Frequently Asked Questions
Why isn't CRM data enough for a growing company?
The CRM shows what the sales team recorded: leads, opportunities, quotes, and the forecast. It doesn't show delivery delays, billing problems, ticket volume, or fading account activity, even though those are what predict future revenue risk. In a growing company the gap widens quickly, because as the customer count rises, a larger share of the events that matter happens outside the CRM.
What does operational visibility mean?
Operational visibility means data from sales, delivery, finance, and support comes together in one view automatically, and exceptions surface without anyone going looking for them. It doesn't mean putting all your data on screen. It means noticing the right changes in time.
Is a new dashboard or report enough to fix it?
No. A dashboard only shows the data already brought into it. If the systems aren't connected, or the numbers are compiled by hand, reporting stays reactive no matter how the report looks. Fix how the data moves first, then how it's presented.
Do you need to replace the CRM to improve visibility?
No. Visibility is built on top of existing systems through integrations. The actual work is modeling the data, solving the shared customer identifier, and defining what counts as an exception. Replacing the system is an expensive way to fix a problem the system didn't cause.
Want to see your whole business in one clear view?
The Automation Assessment identifies which part of your operational load can be automated and how scattered data can be brought together to support managing growth.
Book an Automation AssessmentEmpirica helps growth companies remove operational bottlenecks with automation and operational AI. The Automation Assessment is a fixed-price way to find out where to start.